Market Overview
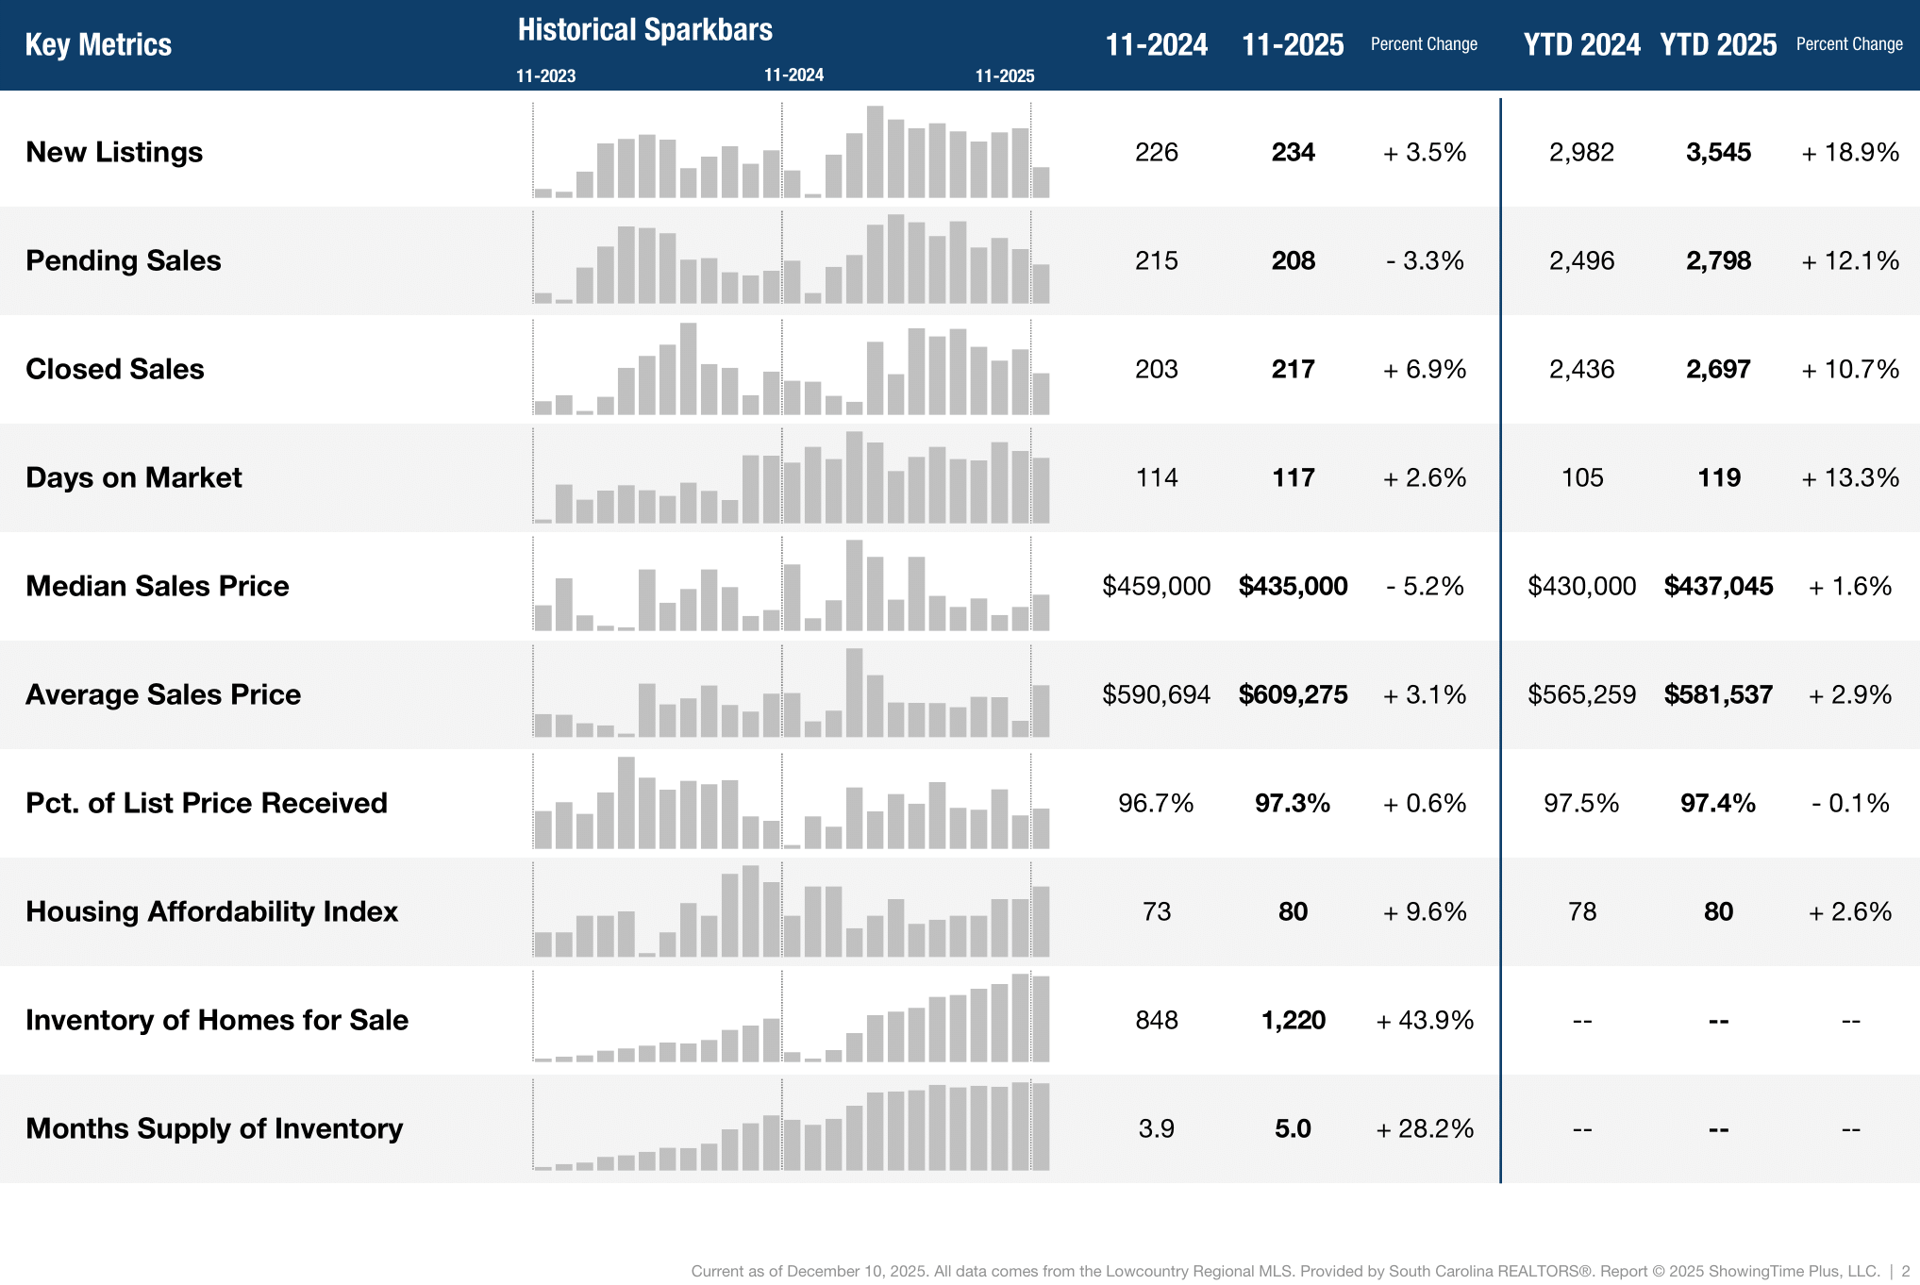
Key market metrics for the current month and year-to-date figures.
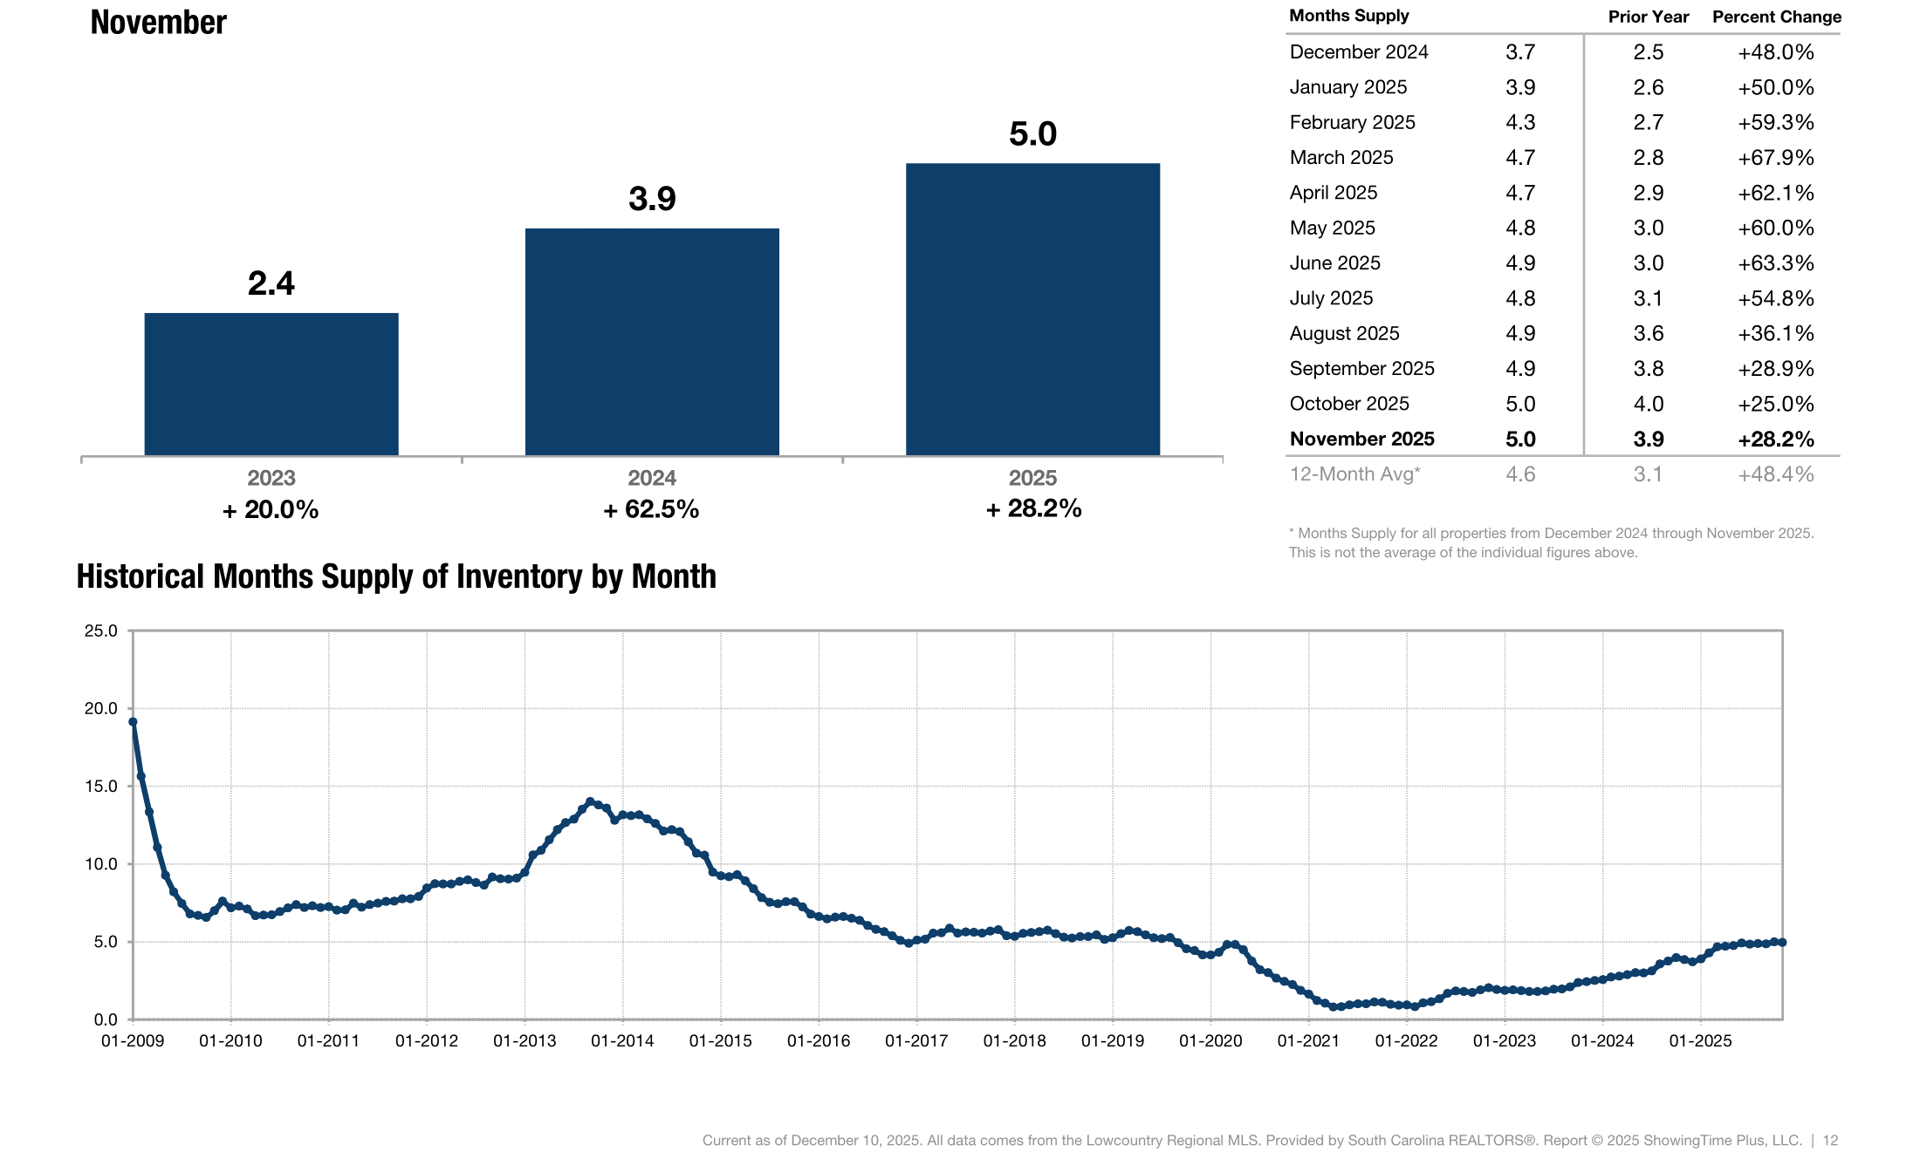
November 2025
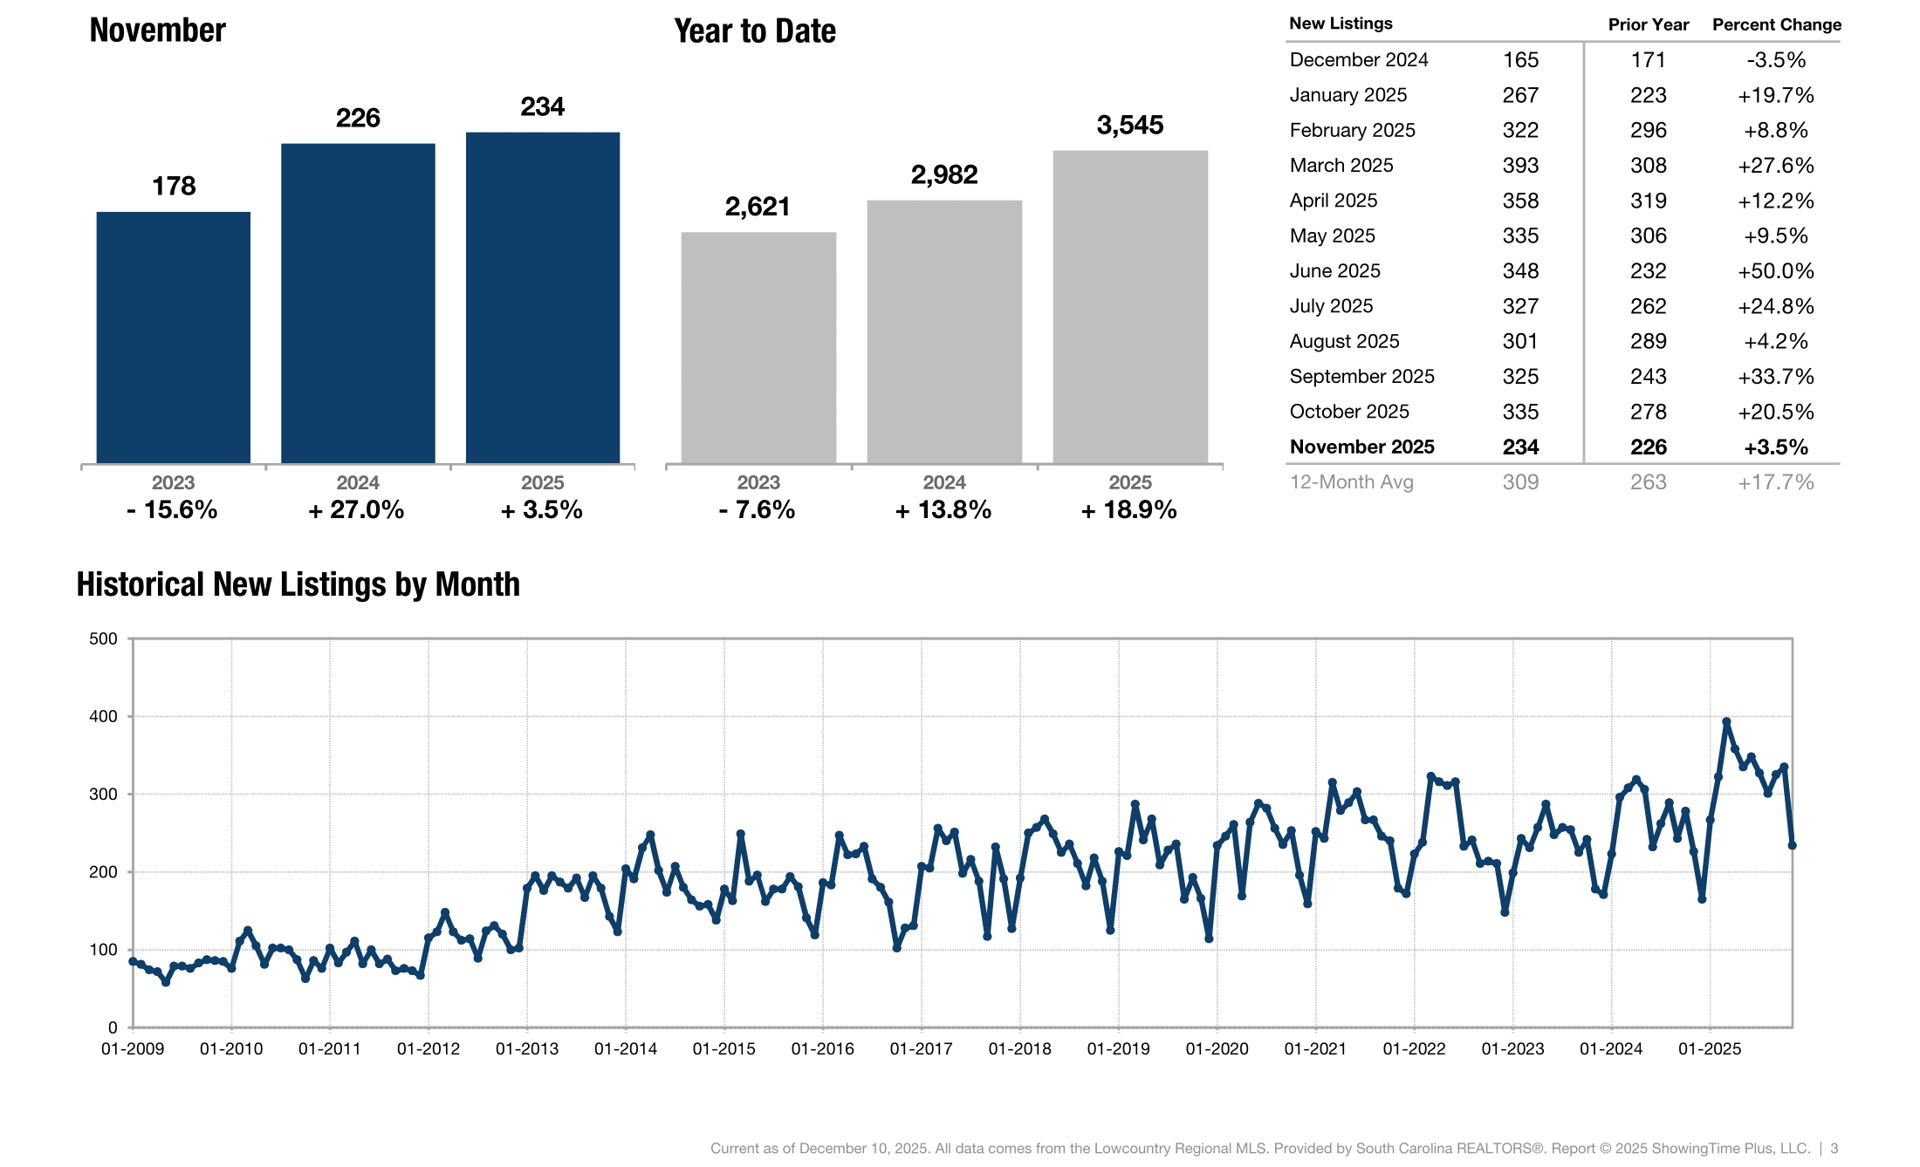
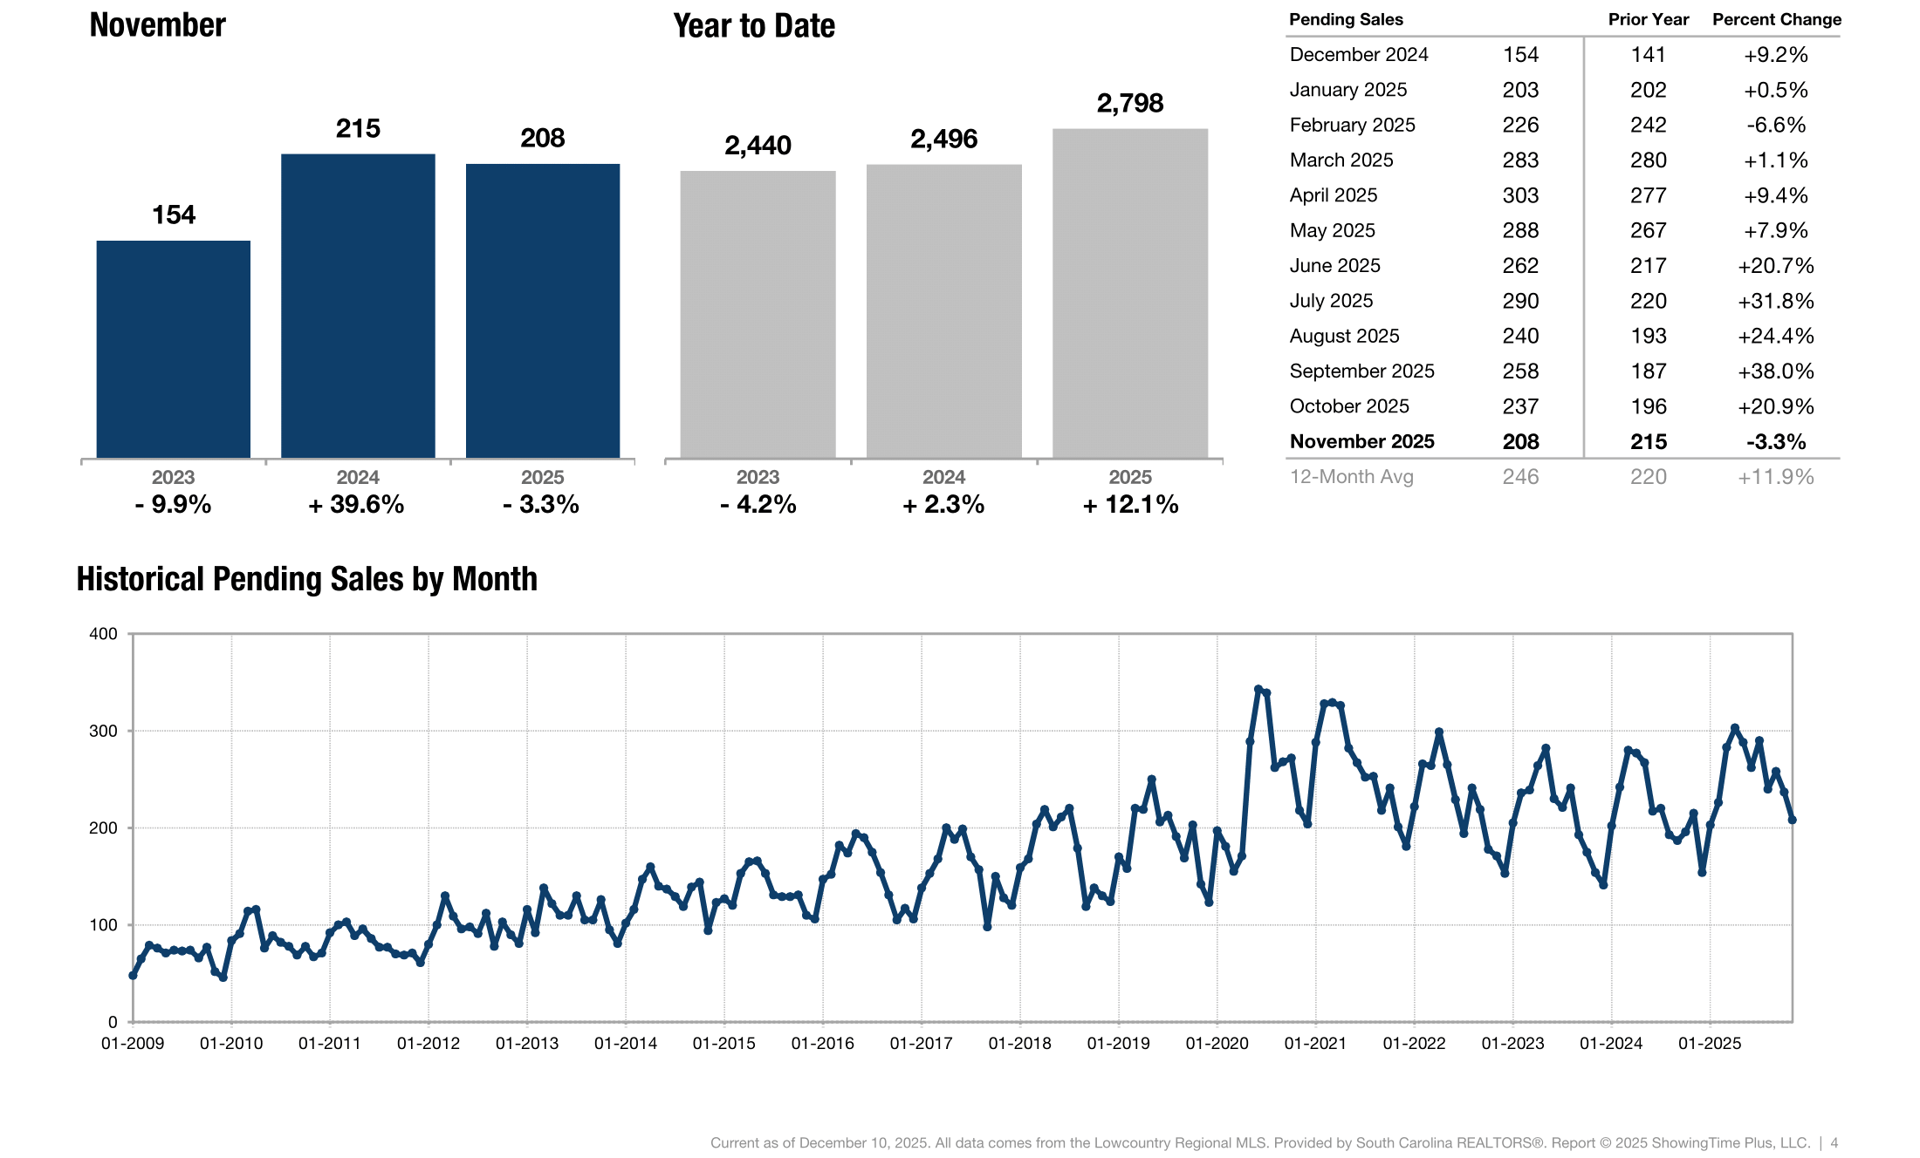
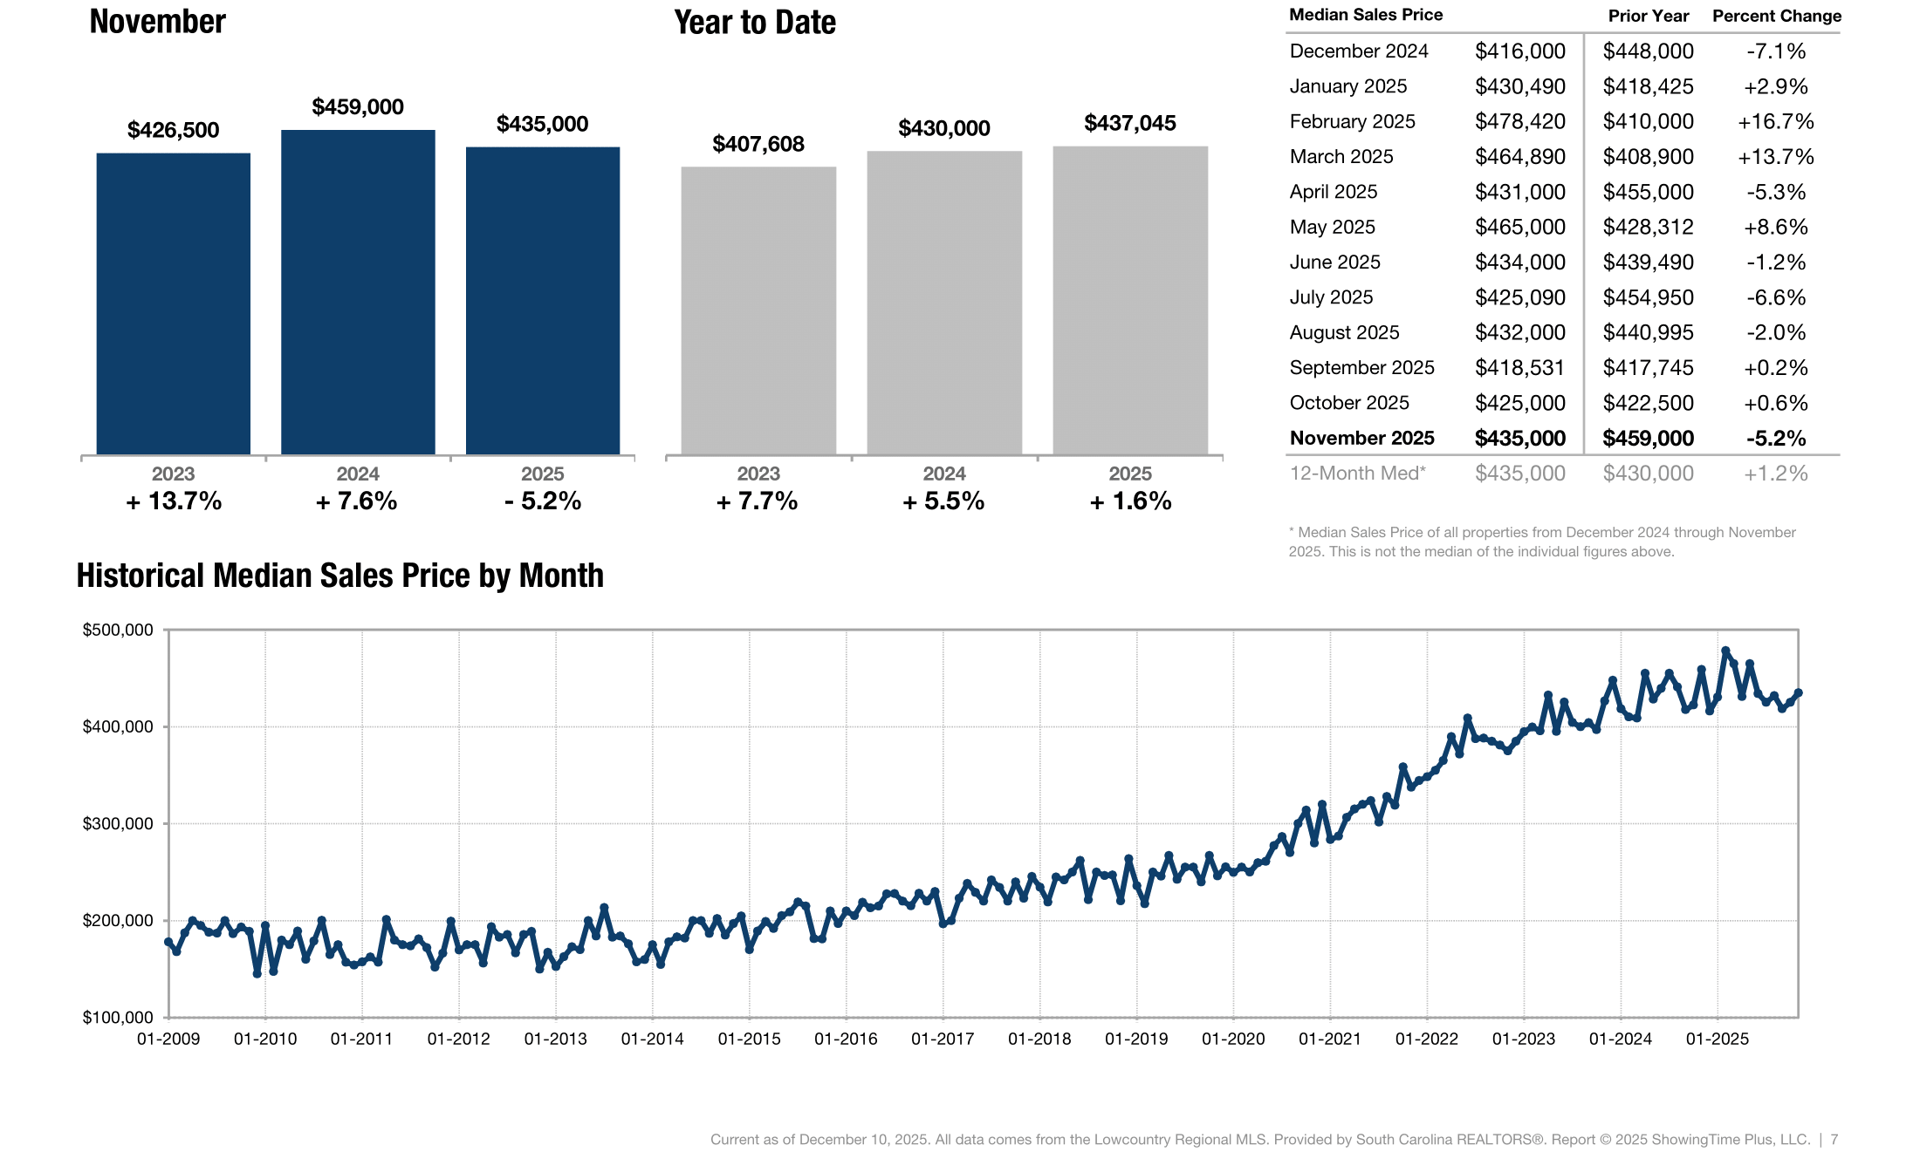
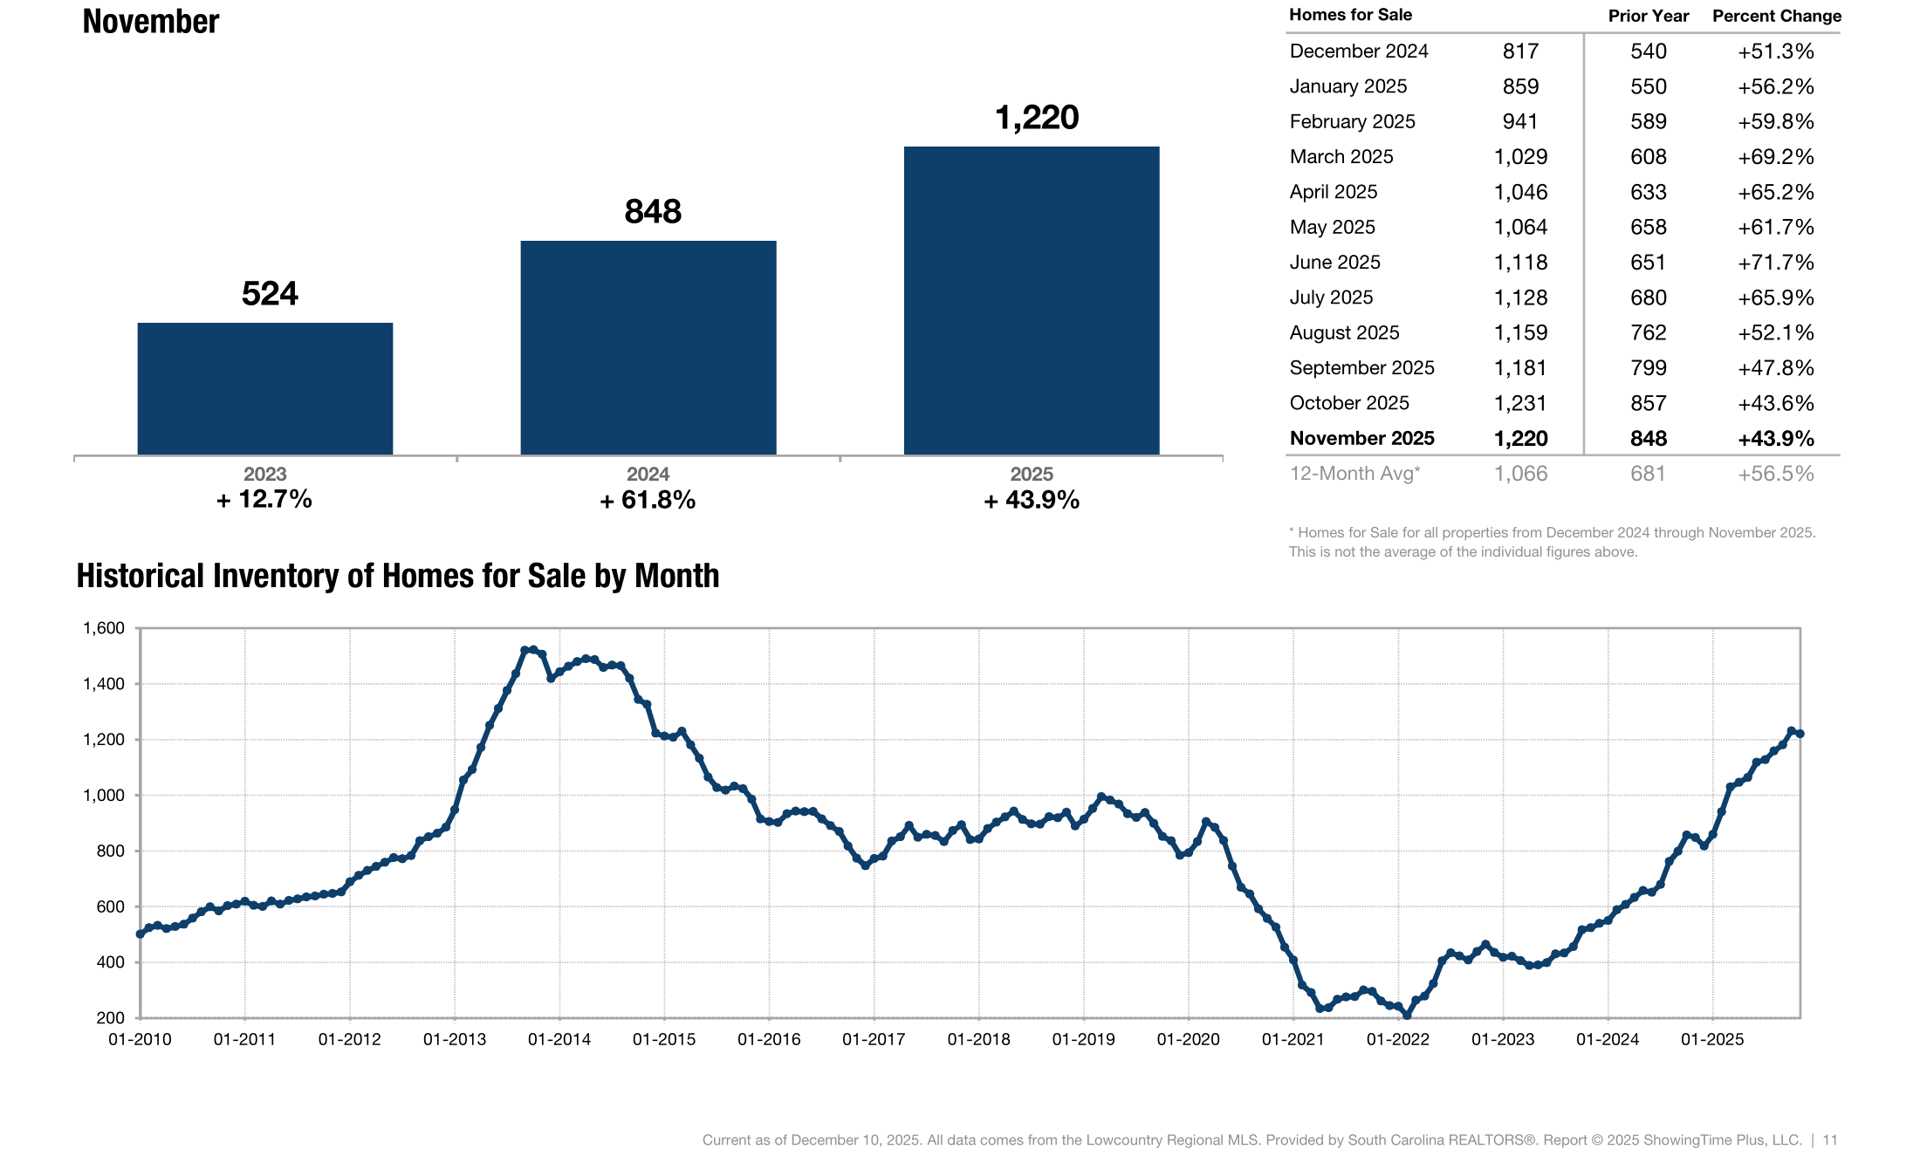
U.S. sales of existing homes rose 1.2% from the previous month to a seasonally adjusted annual rate of 4.10 million, according to the National Association of REALTORS® (NAR), as buyers took advantage of lower mortgage rates this fall. Sales increased in the Midwest and South, held steady in the Northeast, and edged down in the West. Year-over-year, sales were up 1.7%, with gains in the Northeast, Midwest, and South, while the West posted a decline. New Listings were up 3.5 percent to 234. Pending Sales decreased 3.3 percent to 208. Inventory grew 43.9 percent to 1,220 units. Median Sales Price was down 5.2 percent to $435,000. Days on Market increased 2.6 percent to 117 days. Months Supply of Inventory was up 28.2 percent to 5.0 months.
Nationally, inventory dipped 0.7% month-over-month but rose 10.9% year-over- year, totaling 1.52 million units, according to NAR. At the current sales pace, supply stands at 4.4 months, slightly below last month’s level but higher than the 4.1 months recorded a year ago. Supported by modest inventory levels, prices continue to rise, with the national median existing-home price increasing 2.1% year-over-year to $415,200, marking 28 consecutive months of annual gains.
Key market metrics for the current month and year-to-date figures.
A count of the properties that have been newly listed on the market in a given month.
A count of the properties on which offers have been accepted in a given month.
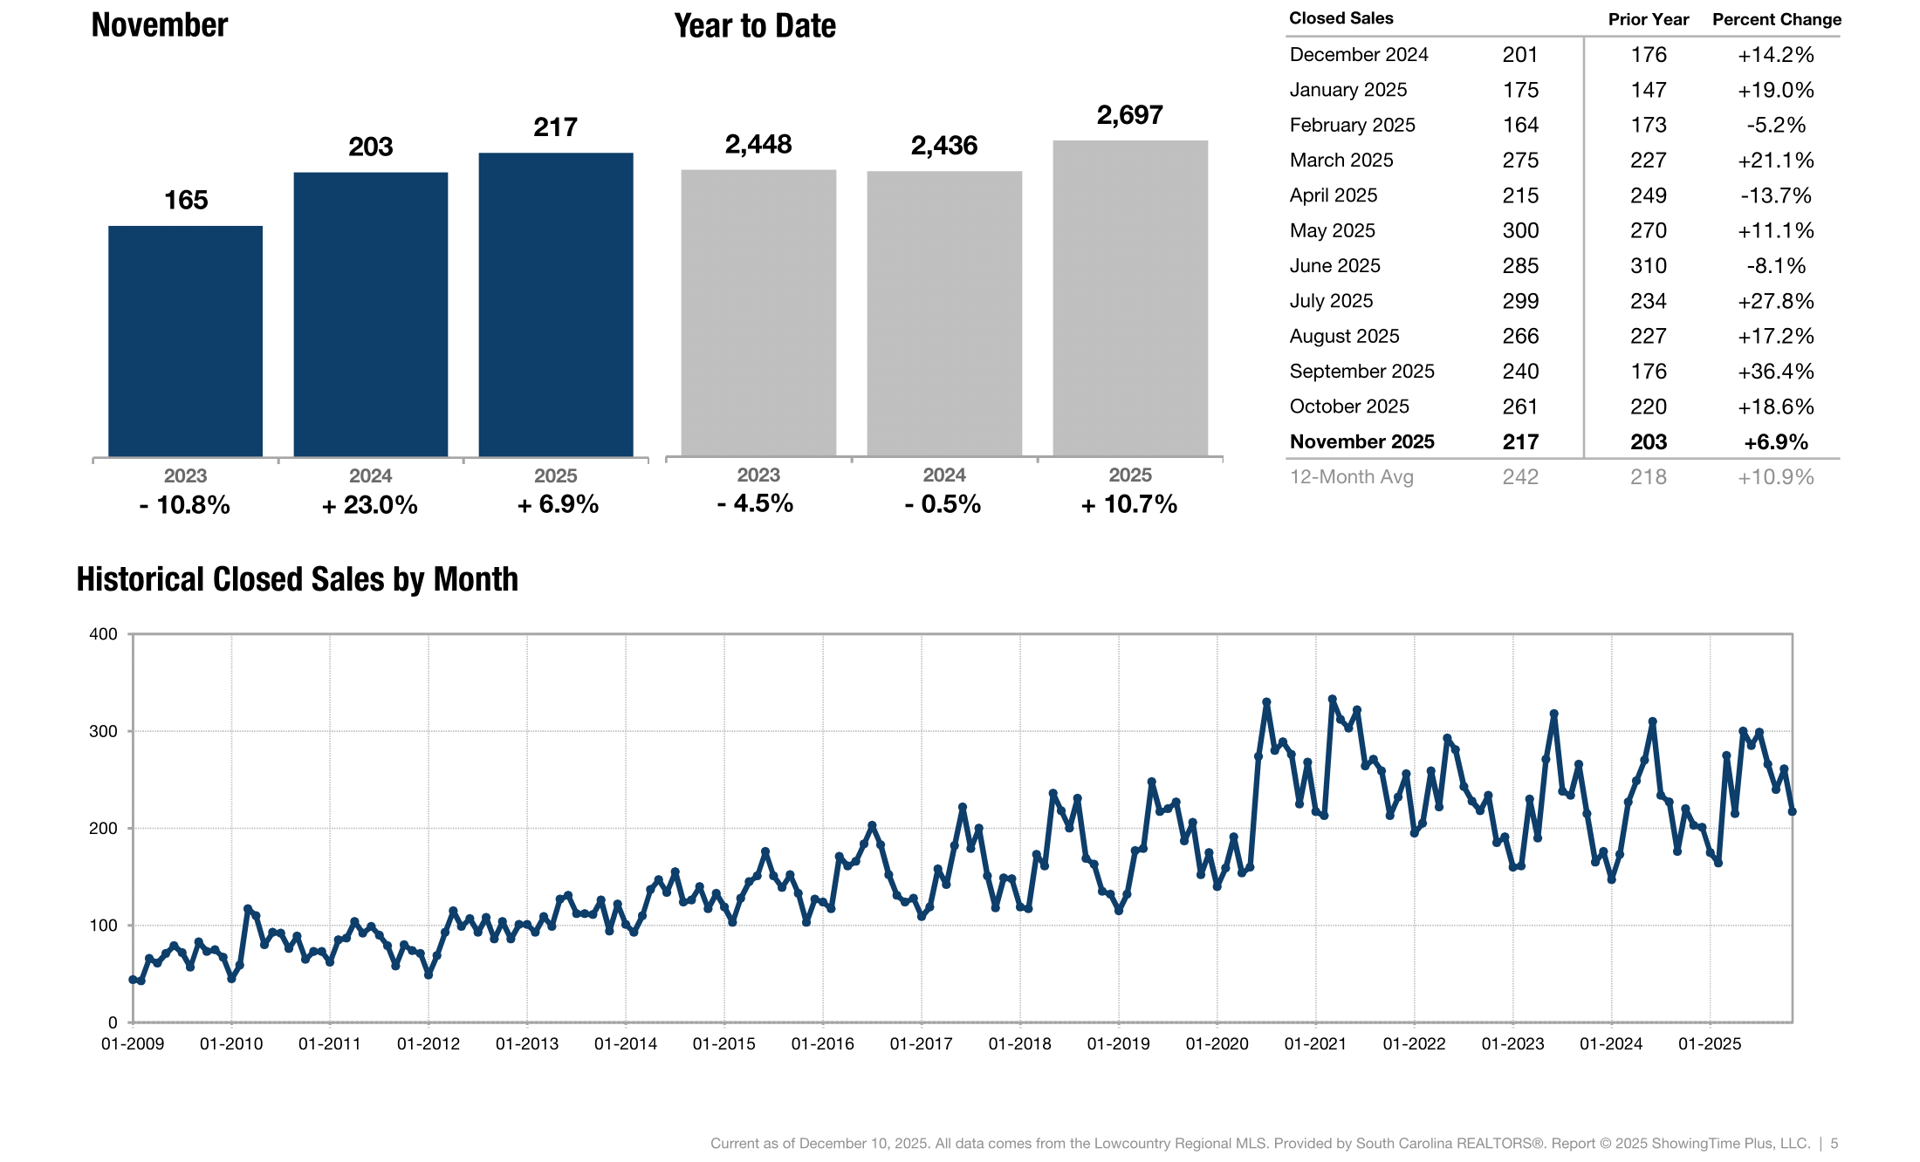
A count of the actual sales that closed in a given month.
Average number of days between when a property is listed and when an offer is accepted in a given month.
Point at which half of the sales sold for more and half sold for less, not accounting for seller concessions, in a given month.
Average sales price for all closed sales, not accounting for seller concessions, in a given month.
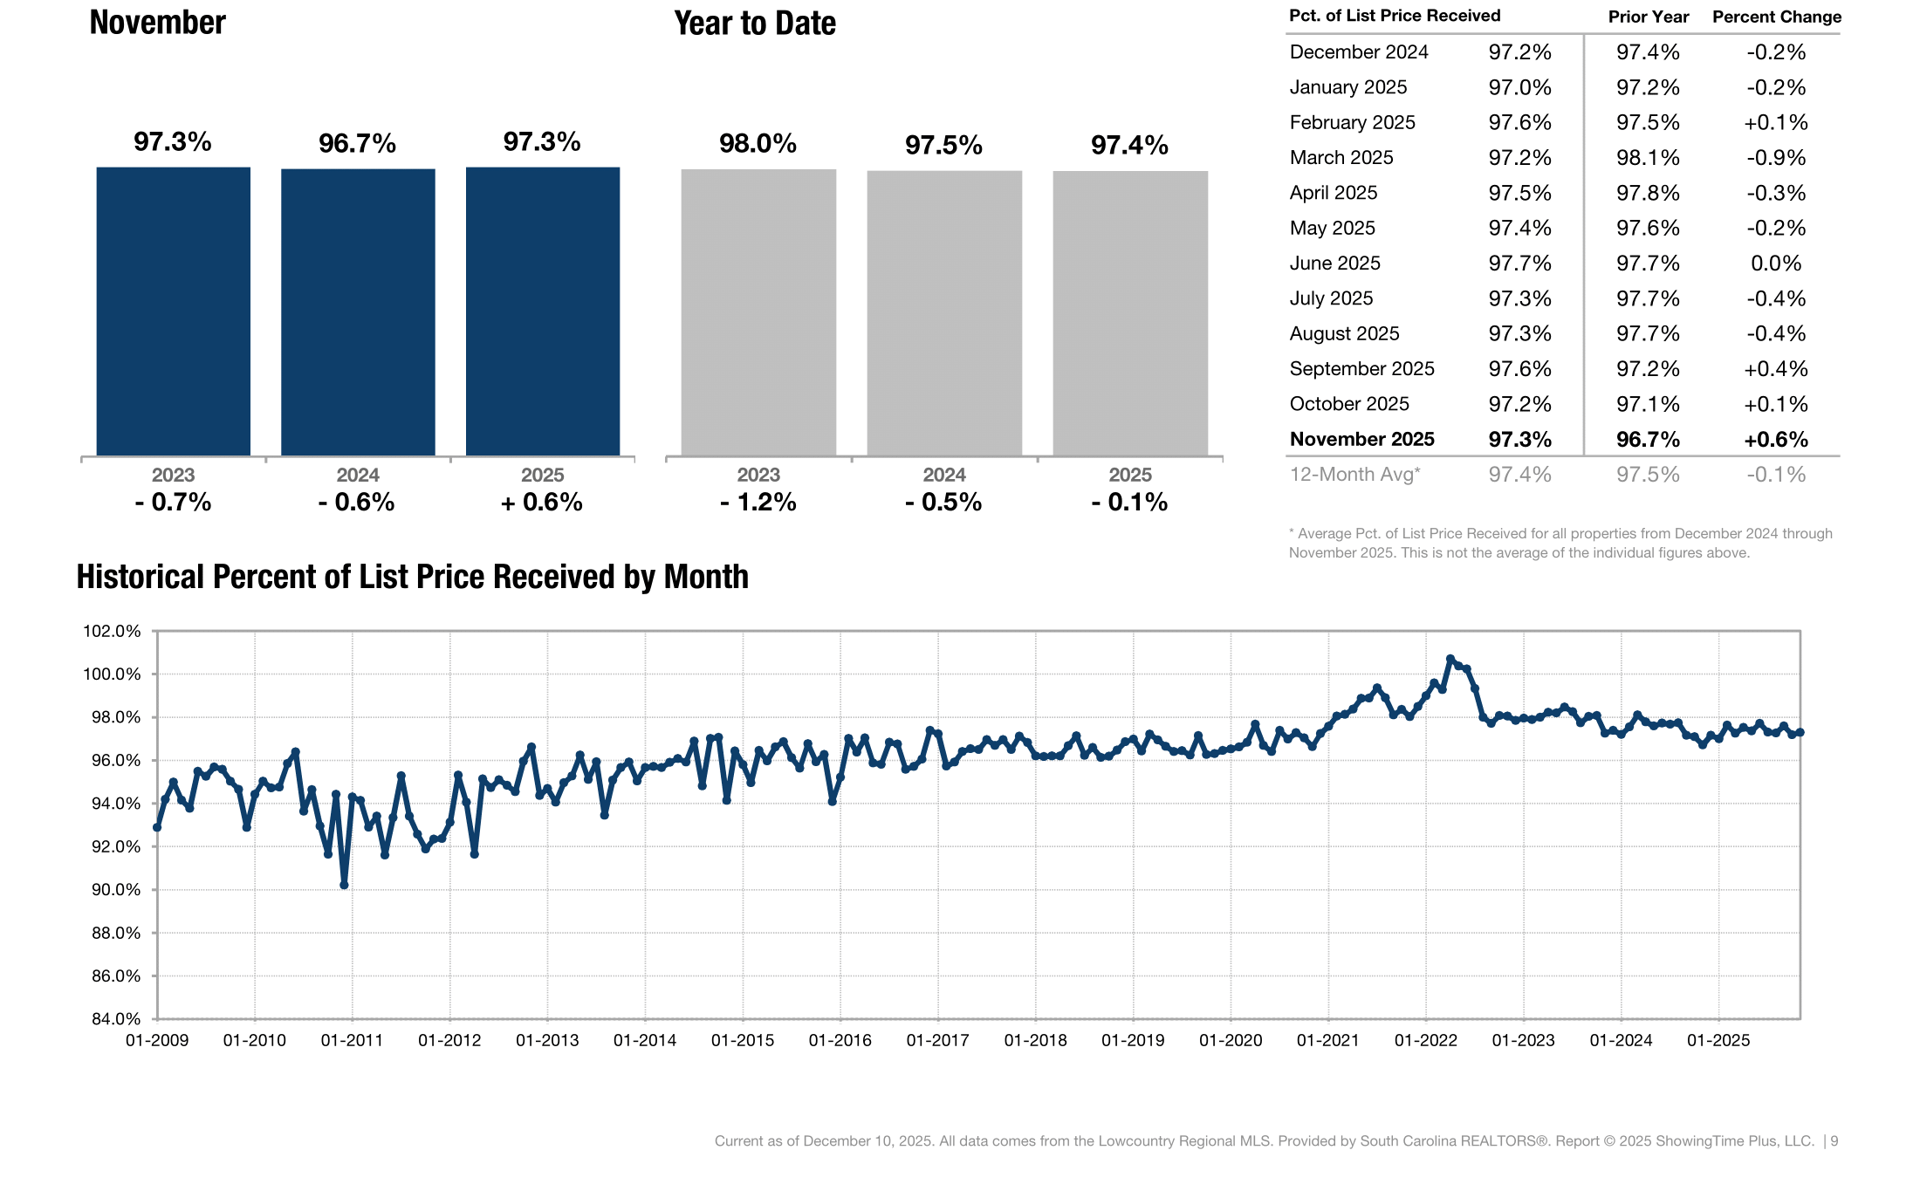
Percentage found when dividing a property’s sales price by its most recent list price, then taking the average for all properties sold in a given month, not accounting for seller concessions.
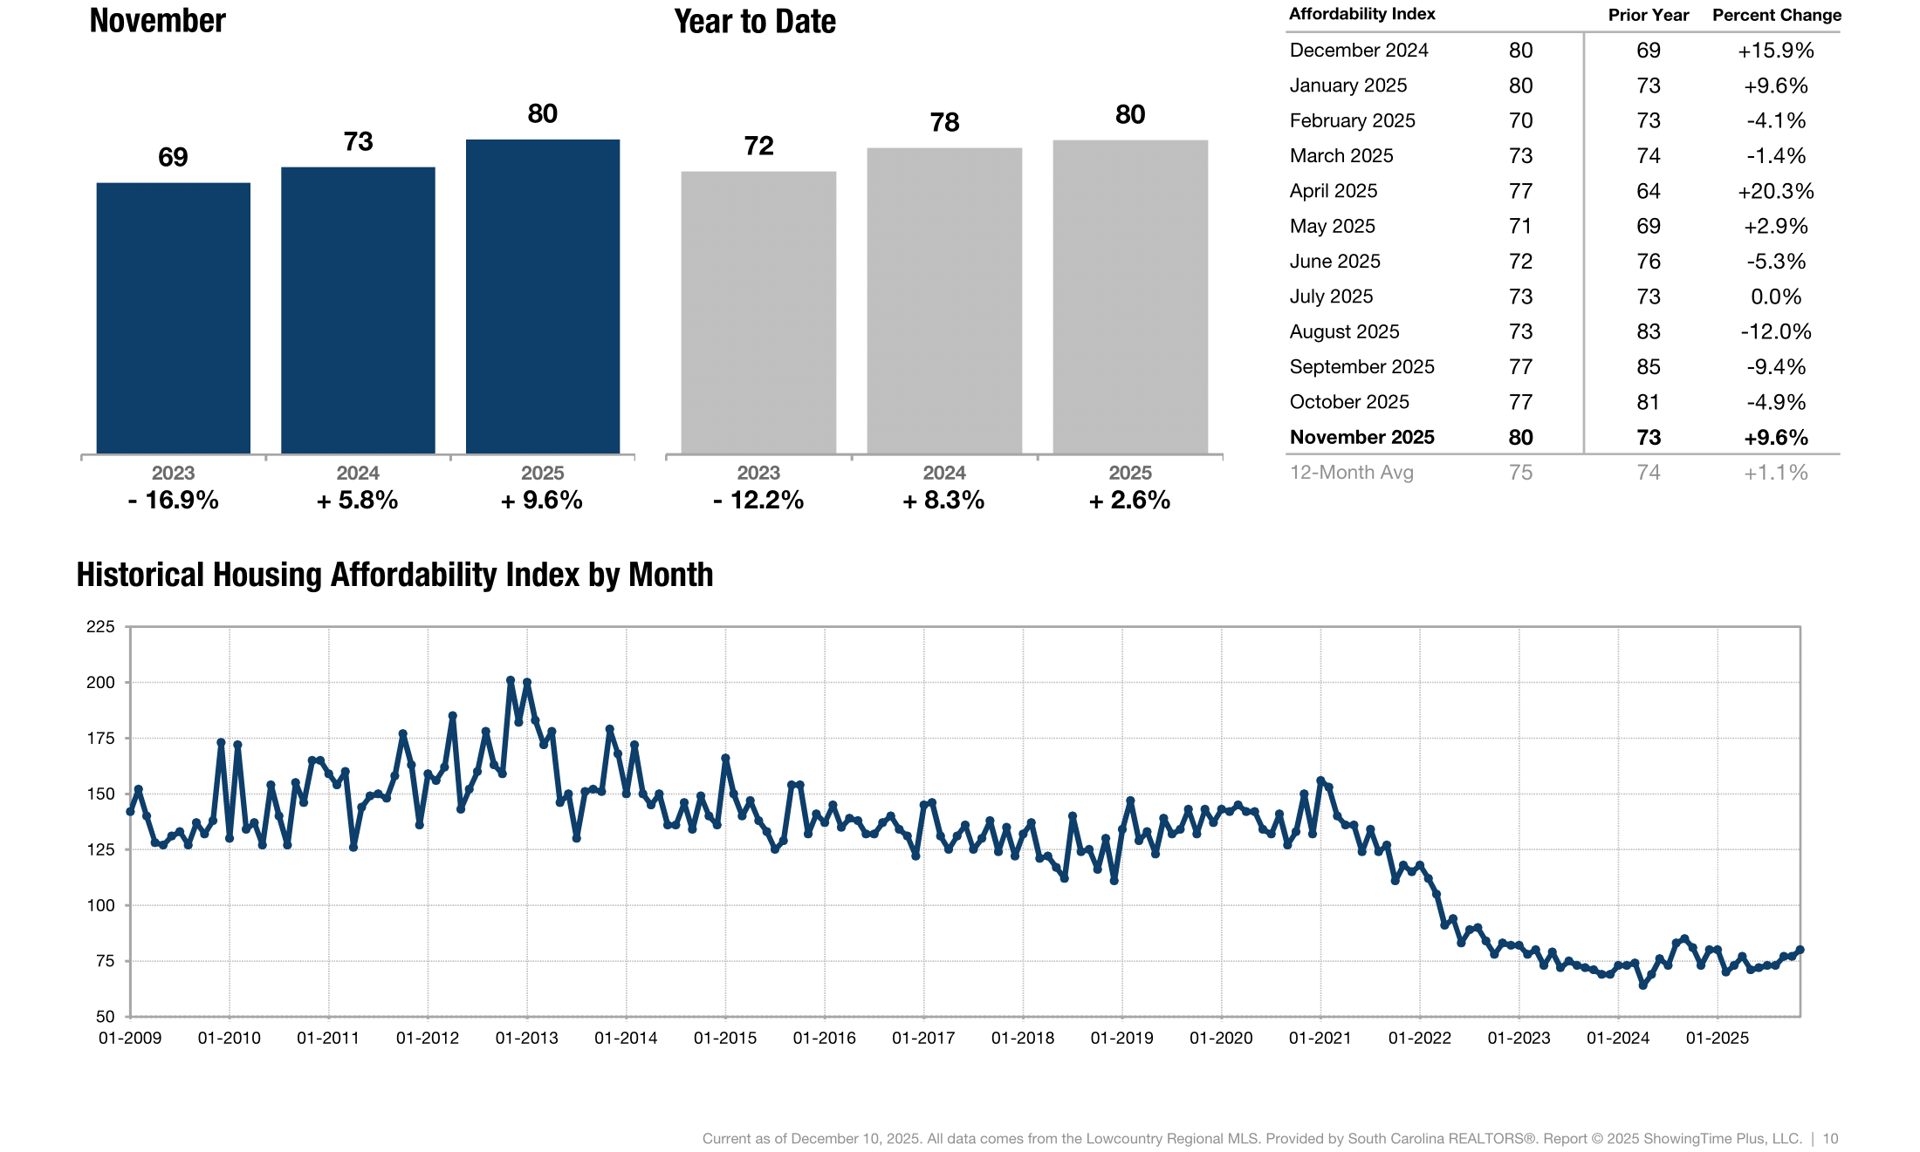
This index measures housing affordability for the region. For example, an index of 120 means the median household income is 120% of what is necessary to qualify for the median-priced home under prevailing interest rates. A higher number means greater affordability.
The number of properties available for sale in active status at the end of a given month.
The inventory of homes for sale at the end of a given month, divided by the average monthly pending sales from the last 12 months.

1204 Boundary St Beaufort SC 29902
1204 Boundary St Beaufort SC 29902